
Elementary Education K–6
For Testing until 12/31/2023
Question 22 of 38
Subtest 4 - Mathematics
Competency 4—Knowledge of measurement, data, and statistics
DIRECTIONS: Read the question and select the best response.
The following circle graph shows the results of a survey of 150 students. How many students chose baseball as their favorite sport?
Favorite Sport
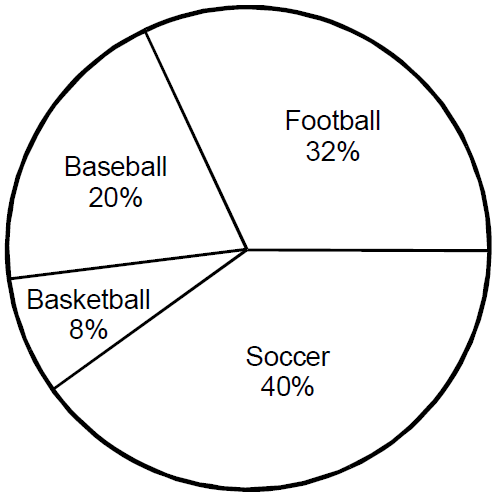
A circle graph has four sections. Baseball is 20 percent of the chart. Football is 32 percent of the chart. Basketball is 8 percent of the chart and finally soccer is 40 percent of the chart.
- Enter to expand or collapse answer. Answer expanded
- Correct Response: C.